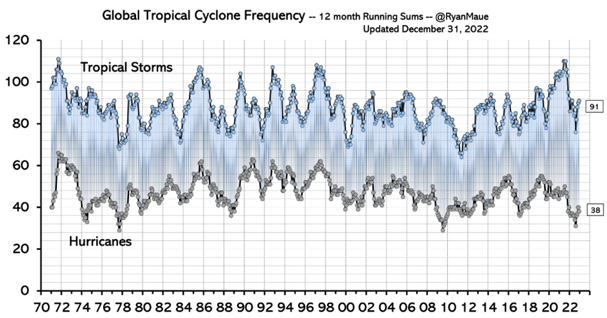
In addition, the authors state that the models predict a decrease in vertical wind shear, which decreases the potential for thunderstorms and tornadoes. The authors claim the models predict an opposing increase in convective available potential energy (CAPE), although if this was true, current global accumulated cyclone energy would not be near the lowest values of the past 40 years.

Global Warming Is Likely to Increase Severe Thunderstorm Conditions in U.S., Research Finds
Sep. 23, 2013 — Severe thunderstorms, often exhibiting destructive rainfall, hail and tornadoes, are one of the primary causes of catastrophic losses in the United States. New climate models suggest a robust increase in these types of storms across the country.
In 2012, 11 weather disasters in the United States crossed the billion-dollar threshold in economic losses. Seven of those events were related to severe thunderstorms.
New climate analyses led by Stanford [aka "global warming central"] scientists indicate that global warming is likely to cause a robust increase in the conditions that produce these types of storms across much of the country over the next century.
Severe thunderstorms are one of the primary causes of catastrophic losses in the United States and often exhibit the conditions that generate heavy rainfall, damaging winds, hail and tornadoes.
Sparse historical data describing the atmospheric conditions that cause severe thunderstorms has limited scientists' ability to project the long-term effects of global warming on storm frequency. But, using a complex ensemble of physics-based climate models, researchers led by Noah Diffenbaugh, an associate professor of environmental Earth system science at Stanford, have produced the most comprehensive projections of severe storm conditions for the next century.
Scientists have identified two main ingredients involved in generating a severe thunderstorm. The first is that the atmosphere must contain a significant amount of what scientists call convective available potential energy (CAPE), created as the air in the low atmosphere warms. The warm air rises, carrying with it moisture to higher altitudes. [Note if CAPE was actually increasing, global accumulated cyclone energy would not be declining for the past decade]
To transform into a severe thunderstorm, CAPE must also interact with strong vertical wind shear -- essentially a moving wind current that organizes the atmospheric energy and moisture such that it can sustain a storm.
Climate researchers have previously hypothesized that global warming will increase CAPE and cause an overall decrease in wind shear, which created uncertainty about the net effect.
The new climate model experiment that Diffenbaugh and his co-authors analyzed, called the Coupled Model Intercomparison Project (CMIP5)[CMIP5 models are the ones previously falsified], confirms these competing effects, but in a different way than previously believed.
Although the climate model experiment does indicate an overall decrease in the average amount of wind shear, the researchers found that the bulk of that decrease occurs on days that produce levels of CAPE that are much lower than is normally seen during severe storms.
The net effect is that the increases in CAPE on other days drive increases in the occurrence of severe thunderstorm environments.
"We're seeing that global warming produces more days with high CAPE and sufficient shear to form severe thunderstorms," said Diffenbaugh, who is also a senior fellow at the Stanford Woods Institute for the Environment.
Stormy springs ahead
The analysis carved the United States into boxes that were roughly 60 miles on a side and assessed the climate conditions that could emerge over the next century. The analysis showed the biggest changes occurring in the spring season, with each box in the central United States experiencing about two-and-a-half additional storm days per spring by the late 21st century.
The researchers also reported that sustained global warming is likely to cause robust increases in storm days over large areas of the eastern United States not only in spring but also in winter and autumn. While the summer season also showed increases over the region as a whole, those increases were the least robust within the region and across the different climate models.
An additional few days of severe storm conditions might not seem like a large change, but Diffenbaugh emphasized that the projected increases are in fact substantial compared to the frequency of occurrence in the current climate.
"We are looking at the conditions that produce severe events, which are relatively rare at present," Diffenbaugh said. "For example, the changes during spring represent an increase of about 40 percent over the eastern U.S. by the late 21st century."
Diffenbaugh also emphasized even a single severe storm can cause very high levels of damage.
"The severe thunderstorms we experience now can result in very high economic losses," Diffenbaugh said. "Sadly, we have many examples of cases where a single storm has had disastrous impact. So a 25 or 30 percent increase in the annual occurrence represents a substantial increase in the overall risk."
Potential for more tornadoes
Such storms also create conditions that can lead to tornado formation, although the researchers stress caution in drawing conclusions specifically about the effect of global warming on tornadoes.
"We have tried to analyze the atmospheric conditions that are associated with tornadoes," Diffenbaugh said. "Although we do see that those conditions increase in occurrence in response to global warming, it is important to bear in mind that we are not resolving tornadoes in these experiments." [wrong again - tornadoes are primarily related to wind shear increases, so if there is a decrease in wind shear, there will be fewer tornadoes]
Diffenbaugh hopes to build on this research to improve the understanding of the atmospheric dynamics that lead to the development of severe thunderstorms, and to better incorporate those processes into climate models.
"These are rare but significant events," Diffenbaugh said. "This new set of global climate model experiments has provided some important new insights. What we need to do next is [get tons of government grant money to] develop ways to better represent the processes that produce individual storms in the real atmosphere."
The study is published in the current issue of Proceedings of the National Academy of Sciences.
Journal Reference:
Noah S. Diffenbaugh, Martin Scherer, and Robert J. Trapp. Robust increases in severe thunderstorm environments in response to greenhouse forcing. PNAS, September 23, 2013 DOI: 10.1073/pnas.1307758110
Source: Climatic Change, Volume 50, Number 4, September 2001 , pp. 489-503(15)
Thunder-day occurrences during a 100-year period based on data from carefully screened records of 86 first-order stations distributed across the United States were assessed for temporal fluctuations and trends during 1896–1995. Short-term ( < 10-year) fluctuations of adjacent stations were often dissimilar reflecting localized differences in storm activity in a few years, making spatial interpretations difficult. But, temporal fluctuations based on 20-year and longer periods exhibited regional coherence reflecting the control of large, synoptic-scale weather systems on the distribution of thunderstorms over broad areas. Classification of station fluctuations based on 20-year periods revealed six types of distributions existed and they formed 12 discrete areas across the nation. One type present in the lower Midwest and the South had a peak in storm activity in 1916–1935 followed by a general decline to 1976–1995. A second type maximizing at the same time had its minimum earlier, in 1956–1975. Another distribution found at stations in the upper Midwest and Northeast had a mid-century peak (1936–1955) with a recent minimum in 1976–1995. A fourth distribution also peaked in 1936–1955 but had an early minimum in 1896–1915, and it mainly occurred in the northern plains and Rocky Mountains. A fifth distribution peaked during 1956–1975 and was found at stations in four areas including the central High Plains, Southwest, northern Great Lakes, and Southeast. The sixth temporal distribution showed a steady increase in storm activity during the 100-year period, peaking in 1976–1995, and covered a large area extending from the Pacific Northwest across the central Rockies and into the southern High Plains. The national average distribution based on all station values peaked in mid century. The national distribution differs markedly from several regional distributions illustrating the importance of using regional analysis to assess temporal fluctuations in severe weather conditions in the nation. The 100-year linear trends of the 86 stations defined six regions across the U.S. Significant upward trends existed over most of the western two-thirds of the nation, unchanging trends existed in the northern plains and Midwest, and downward trends were found in most of the nation's east. The up trends in storm-day frequencies in the southern plains occurred where storm damage is greatest and where demographic changes have added to storm losses over time. The national patterns of trends and storm distributions were similar to those found for hail. The temporal distributions of storm activity helped explain recent increases in major storms and their losses, conditions which have increased in the west and south.
Related: Why warming reduces the occurrence and intensity of tornadoes
I think it may have been a mistake to use US conditions. There could be an effect in the West Pacific "Hot Spot" that is real. However, the ceiling temperature is about 31 degrees C, the Pacific hasn't warmed for 20 years ...
ReplyDeleteI added another chart above showing global tropical storm frequency has declined since 1970, the opposite of the trend in CO2.
DeleteLet me know if you have a global dataset on storm activity that goes back before 1970, but these would be suspect before the satellite era.
Oh brother USA Today reports Trenberth thinks "this study is fairly robust"
ReplyDeletehttp://www.usatoday.com/story/weather/2013/09/23/climate-change-global-warming-thunderstorms-tornadoes/2854979/
Another PNAS piece of crap.
ReplyDeleteYeah, most of the papers published in PNAS do not go through any peer-review or even pal-review, but what they call "direct submissions" from NAS members. Any NAS member that signs on as a co-author can use that trick to publish whatever crap they want.
Delete